
The Humanoid Value Chain: Where Does the Money Actually Go?
The trillion-dollar stack. Six layers. Three profit pools. Where the next decade of capital actually accrues.

Two years ago, Unitree had one humanoid robot. The H1 cost about as much as a Tesla Model S. $90,000, give or take.
Today Unitree has four. The R1 starts at $4,900. The G1 at $13,500. The H2 at $29,900. The H1 at $90,000 still anchors the top.
Unitree’s IPO prospectus, filed in March on Shanghai’s STAR Market, shows the company’s average selling price across this expanded humanoid line: ¥593,400 in 2023, ¥260,700 in 2024, ¥167,600 in the first three quarters of 2025. A 72% decline. Five units sold in 2023. Over five thousand five hundred in 2025, making Unitree the world’s top-selling humanoid manufacturer.
Unitree is one company among hundreds. The same 24 months saw the global humanoid funding pool grow faster than at any point in history. $3.1 billion across 60+ deals in the first half of 2025 alone, exceeding the entire 2010-to-2024 cumulative total. Morgan Stanley projects $5 trillion by 2050. Barclays calls humanoids the next major industrial theme. Every major investment bank now has a coverage report.
What none of those reports tells you, with any useful precision, is where the money will actually go.
The standard Wall Street framing groups everything into “humanoid robotics” as if it were one industry. It isn’t. The stack contains at least six layers, and the profit pools beneath them behave in structurally different ways. Some layers will commoditize within five years. Some will produce a handful of trillion-dollar winners. Some will generate textbook mass-extinction events that wipe out most current entrants. Conflating them is how fortunes get destroyed.
This essay is a first attempt to map the stack at the resolution the moment requires. Six layers, decomposed. Three profit pools, named. Representative companies positioned in each. And a thesis at every level.
This is the first article of Capital & Atoms, a new research thread within Robonaissance focused on the investment economics of humanoid robotics. If the framework here resonates, the articles that follow will go deeper.
The funding flow is undeniable. The framework is missing. That’s the gap this essay tries to fill.
The Analysis Gap
Walk through the public reports a careful investor would actually read.
Morgan Stanley’s Humanoid 100 partitions companies into Brain, Body, and Integrators, which is the closest existing approximation to a stack view. But the framework is built for stock screening, not for the active allocation thesis a humanoid stack at this stage of development requires. Other major banks have published coverage of varying depth, but none, in my reading, treats the stack as an active capital allocation framework that takes a position at each layer.
The same gap exists at higher resolution. The mainstream tech press covers humanoid demos as spectacle. The robotics-specific newsletters cover the news flow. The AI newsletters cover frontier model releases. But the joint distribution of “I read the latest VLA paper” and “I can model the cap table for the company that trains it” is small, and the cross-domain analysis that joins the two sides does not yet exist as a public research product.
It needs to. In dollar terms, the humanoid buildout is already comparable to early-stage AI compute. Figure’s $1 billion Series C at $39 billion, Physical Intelligence’s $600 million round at $5.6 billion, Skild’s $1.4 billion at $14 billion, Apptronik’s $935 million Series A at $5 billion, Agility reportedly raising another $400 million. These are not seed-stage bets. These are growth-stage commitments being made by sovereign wealth funds, OpenAI, Microsoft, Nvidia, Bezos, and increasingly the largest sovereign-linked capital pools in Asia. The decisions being made right now will shape the cap table of the 2030s.
Three forces compound the urgency. First, the Chinese supply chain is now demonstrably ahead in component manufacturing for the most expensive parts of the stack, and that fact is absent from most English-language analysis. Second, the foundation-model layer has bifurcated into at least four distinct technical bets in the last eighteen months, each with starkly different commercial implications. Third, Unitree’s IPO and the public-market path that follows will force valuation discipline onto a sector that has been pricing itself privately, with all the opacity that implies.
This is the moment the framework must arrive. The next eighteen months will see tens of billions of dollars allocated against whatever framework readers have available. If that framework is a one-line entry in a TAM projection or coverage list, the misallocation will be enormous.
Capital & Atoms exists to close that gap. The format is straightforward. Each piece maps one slice of the humanoid robotics landscape at the resolution actual capital allocation requires. Some pieces will be technical reads of foundation model architectures. Some will be supply-chain decompositions down to the specific Chinese precision-component supplier. Some will be uncomfortable assessments of which companies are going to fail. All of them will end with a structured thesis the reader can take to a meeting and use.
The first piece is this one. The stack itself.
The Six-Layer Stack
A humanoid robot, viewed as an investment object, is not one product but a stack of six. Each layer has its own competitive dynamics, its own profit margin profile, and its own answer to the only question that matters in the long run: what makes the cash flow defensible.
The layers, from intelligence down to industrial physics:
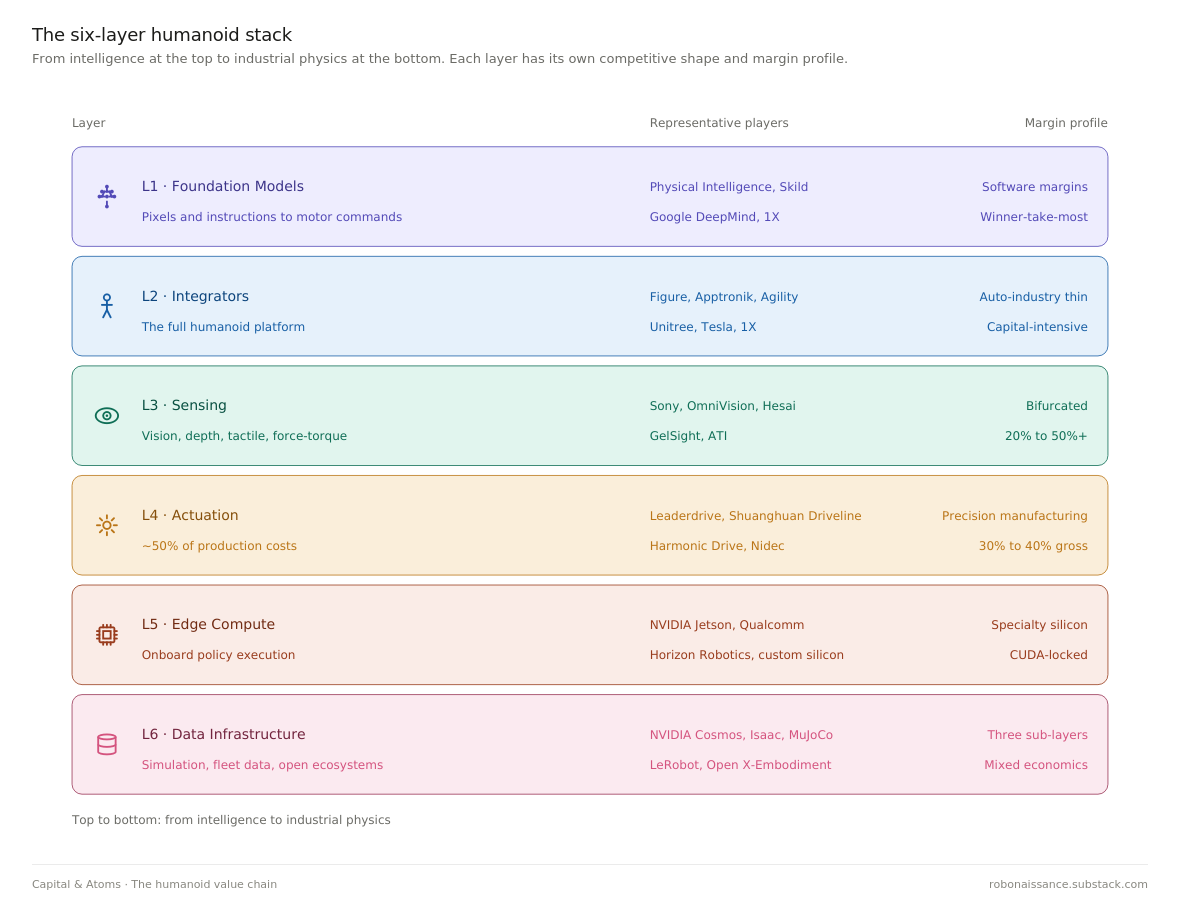
L1 Foundation Models L2 Integrators L3 Sensing L4 Actuation L5 Edge Compute L6 Data Infrastructure
Each layer below gets the same treatment. What it does in one sentence. The current competitive shape. Where the margin lives. Representative names with valuation reference points where available. And a thesis I expect to be held to.
L1: Foundation Models
This is the layer where the robot’s brain is trained. Vision-Language-Action models, or VLAs, learn to take in pixels and instructions and emit motor commands. The training happens in data centers on clusters of thousands of GPUs. What gets shipped to the robot is the resulting policy: a set of weights and an inference recipe. The technical lineage runs from Google’s RT-2 in 2023 through Physical Intelligence’s π-0 in 2024 and π-0.5 in 2025, alongside Figure’s Helix and a growing list of open-weight contenders.
The competitive shape is recognizable to anyone who lived through the LLM moment of 2022 to 2024. A small number of well-capitalized labs are racing to train ever-larger generalist policies on a combination of teleoperation data, simulation, and internet-scale video. Physical Intelligence has raised roughly $1.1 billion in total, most recently $600 million led by Google’s CapitalG at a $5.6 billion valuation, and has recruited a meaningful share of the senior robotics learning talent that left Google and Meta. Skild has raised roughly $1.8 billion in total, with its January 2026 round led by SoftBank tripling its valuation to over $14 billion on a hardware-agnostic generalist-policy thesis. Google DeepMind continues to publish, with the Gemini Robotics line representing the in-house bet. 1X is building its own foundation model in tight integration with its NEO platform. Several Chinese efforts, most visibly from Galbot and Agibot, are training on domestic hardware fleets that the Western labs cannot easily replicate.
Margins at this layer, if a winner emerges, will be among the highest in the entire stack. The economic structure mirrors the LLM API business. A trained policy is software, replicable at near-zero marginal cost, distributed across whatever hardware customers operate. The cost of training is enormous and rising. The cost of serving is meaningful but improvable. The moat is data flywheel and talent density, both of which compound. The data flywheel in this layer is built on teleoperation data, simulation, and internet-scale video, not on real-world deployment data, which accrues to whichever L2 integrator owns the robot fleet. This distinction matters: if real-world deployment data becomes the dominant training signal over the next five years, L1 economics deteriorate and the layer’s value migrates to L2.
The risk is also recognizable. Most of these labs will not survive as independent entities. The training-cost curve and the talent-cost curve both run in directions that favor concentration. Two or three winners is the historical pattern in AI infrastructure, and there is no obvious reason robot foundation models break the pattern.
Thesis: L1 is the highest expected-value layer in the stack and the highest variance. Within five years, two players will hold more than 60% of meaningful enterprise robot foundation model deployments outside Tesla’s vertical stack. I expect Physical Intelligence to be one. The second seat is genuinely contested between Skild, Google’s in-house effort, and a Chinese entrant currently underweight in Western analysis.
L2: Integrators
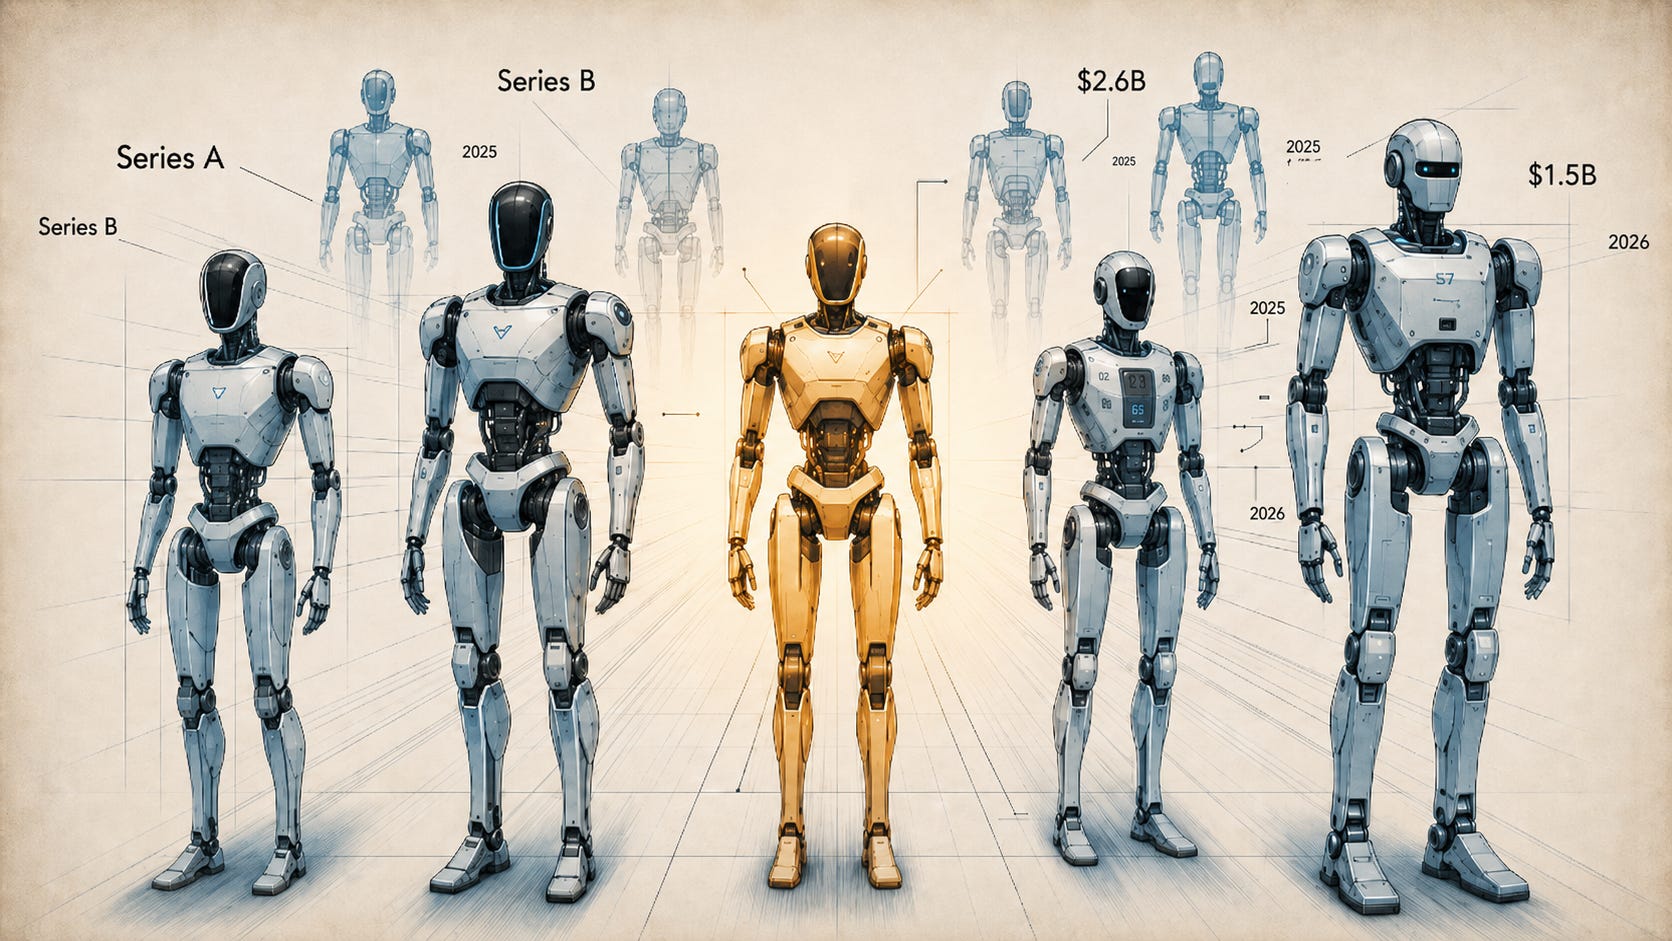
This is the layer everyone photographs. The full humanoid: legs, torso, arms, hands, head, the thing that walks across the stage at conferences and ends up on magazine covers. Figure, Apptronik, Agility, 1X, Unitree, UBTech, Tesla, plus a long tail of Chinese entrants whose names will be familiar in two years and forgotten in five.
The competitive shape here is the most crowded in the stack. Counterpoint Research counts more than 100 active humanoid companies in China alone, with the analyst consensus expecting consolidation to a few dozen survivors over the next IPO cycle. The American field is smaller in count but no less crowded in capital. Figure raised $675 million at a $2.6 billion valuation in early 2024, then closed a Series C exceeding $1 billion at a $39 billion post-money valuation in September 2025. Apptronik raised $350 million in early 2025, then extended its Series A with another $520 million in February 2026 at a roughly $5 billion valuation. Agility was reported to be raising $400 million. 1X has shipped early units of NEO into homes. Tesla is a category unto itself, with Optimus serving simultaneously as the most-watched humanoid program and the least independently verifiable.
Margins at this layer follow the historical pattern of integrated hardware businesses, which is to say, thin and brutal. The bill of materials is dominated by precision components purchased from L4 suppliers. The software is increasingly purchased or licensed from L1 model providers, or built in-house at significant ongoing R&D cost. What remains for the integrator is design, system integration, manufacturing scale, and customer relationships. The closest analogue is the automotive industry, where companies that sell complete vehicles run gross margins in the high teens to mid-twenties and net margins in the single digits, while their tier-1 component suppliers can run higher.
Unitree is the early disconfirming case. Profitable, scaling, and aggressively cutting price. The IPO prospectus shows operating margins that look more like a precision-component manufacturer than a traditional integrator, which is what happens when you vertically integrate the highest-cost components and serve a market segment that values capability per dollar over polish. Whether that economic structure scales beyond hobbyist and research customers into the industrial workhorse segment is the open question of the next 24 months.
Thesis: L2 is the layer most likely to produce textbook capital destruction at the median, alongside two or three trillion-dollar winners at the right tail. The expected value calculation is real but the variance dominates. The winners will look like vertically-integrated automakers, not like SaaS companies. Apple’s iPhone is a bad analogy. Toyota’s Camry is a better one.
L3: Sensing
Before a humanoid can do anything useful, it has to know what is in front of it. Cameras, depth sensors, force sensors at the joints, tactile sensors at the fingertips, IMUs in the torso, microphones, and the perception software that turns raw signals into a usable scene representation. The sensor stack on a current-generation humanoid runs to several thousand dollars per unit. The stack on a humanoid that can actually fold laundry without breaking the fabric runs higher, and the gap between those two numbers is where the layer’s investment thesis lives.
The competitive shape is fragmented and largely consumer-electronics-adjacent. Vision sensors come from Sony, OmniVision, and a long tail of CMOS image sensor specialists. Depth comes from Intel RealSense’s spiritual successors, Orbbec out of China, and a slow drift toward time-of-flight modules sourced from the smartphone supply chain. LiDAR for robotics is increasingly converging on solid-state designs from Hesai, Innoviz, Luminar, and several Chinese auto-LiDAR pivots. Tactile sensing remains genuinely unsolved at the price points humanoids will tolerate, with research-stage entrants like GelSight competing against industrial incumbents from semiconductor and medical adjacencies. Force-torque sensors are dominated by ATI Industrial Automation and a handful of Japanese specialists. None of these companies were founded for humanoid robotics. All of them are now positioning themselves as humanoid suppliers.
Margins at this layer split sharply along two lines. Commodity vision and IMU components carry consumer-electronics gross margins in the 20% to 30% range, with humanoid volumes too small to command pricing premiums. Specialized sensors with no consumer analogue, particularly tactile and high-end force-torque, carry industrial-component margins of 50% or more, but the addressable market is small and the customer base is technically demanding. The bifurcation matters because investors looking at L3 see “robot sensors” as a single theme when the actual economics live at opposite ends of the margin spectrum.
The structural fact that defines L3 is that humanoids are not yet a large enough market to drive the sensor roadmap. The roadmap is being driven by smartphones, automotive, and AR/VR. Humanoids will inherit components designed for those applications, with one or two specialized exceptions. This is good for cost curves and bad for differentiation.
Thesis: L3 produces a small number of category winners in the genuinely robot-specific sensor categories, particularly tactile, while the rest of the layer commoditizes faster than the integrators expect. Investors looking for L3 returns should focus on tactile and force-torque, not on cameras and LiDAR.
L4: Actuation
If L1 trains the brain, L4 builds the body. Harmonic reducers, planetary roller screws, frameless torque motors, encoders, controllers, and the entire mechanical system that converts electrical signals into precise physical force. By Barclays’ decomposition, this single layer accounts for roughly 50% of humanoid production costs. By any honest reckoning, it is also the layer where the United States has lost the supply chain.
The competitive shape is the inverse of L1. Instead of a small number of well-capitalized labs racing on talent and training compute, L4 contains decades-old precision manufacturers. Mature production processes. Deep customer relationships. The kind of capital efficiency that only shows up in industries where the cost of a bad part is measured in field failures rather than user complaints. Harmonic Drive Systems out of Japan has been the global benchmark in strain wave reducers since the 1970s. Nidec dominates a wide range of motor categories. SKF and NSK in bearings. ABB and Siemens in motion control. The Western and Japanese incumbents are profitable, technically excellent, and structurally vulnerable.
The vulnerability is volume. Chinese precision-component manufacturers, particularly 绿的谐波 (Leaderdrive), 双环传动 (Shuanghuan Driveline), and 中大力德 (Zhongda Leader), have spent the last decade closing the technical gap on harmonic reducers and planetary roller screws while operating at cost structures the incumbents cannot match. The Chinese players were not optimizing for humanoid robots. They were optimizing for industrial automation, electric vehicles, and machine tools. The humanoid wave arrived as a windfall, layered on top of supply chains already at scale.
Margins at this layer follow precision-manufacturing economics. Gross margins in the 30% to 40% range for established players, operating margins in the high teens, with significant moat from process know-how and customer qualification cycles that take years. Once a humanoid integrator qualifies a harmonic reducer supplier, switching is expensive enough that the relationship tends to persist for the product lifetime. The Chinese suppliers are now in active qualification with most of the major Western humanoid programs, a fact that will surface in financials over the next two to four quarters.
Battery, structural, and thermal cost categories, 15-25% of BOM combined, ride existing EV, industrial, and consumer-electronics supply chains. None produces investment opportunities distinguishable from their adjacent end markets, which is why this framework does not treat them as separate layers.
Thesis: L4 is where the largest share of humanoid value will accrue over the next five to ten years, and the largest share of that share will accrue to a handful of Chinese precision-component suppliers currently trading at industrial-automation multiples in Shanghai and Shenzhen. This is the most asymmetric trade in the humanoid stack and the one Western analysis is least equipped to see.
L5: Edge Compute
If L1 is where the brain is trained, L5 is where it runs. A foundation model trained on a 10,000-GPU cluster is useless if it cannot execute a control loop at 30 hertz on a battery-powered chassis with a compute power envelope measured in tens of watts. L5 is the layer that turns trained policies into onboard inference, in real time, within thermal and power constraints that have no parallel in the data center.
The competitive shape is NVIDIA-dominant in a way that mirrors its training-side position. The Jetson Orin platform, paired with the Isaac robotics SDK, is the default development target for nearly every Western humanoid program. Qualcomm has positioned its Robotics RB-series chips as the mobile-derived alternative, leveraging a decade of smartphone power-efficiency engineering. Ambarella occupies a vision-focused niche. Tesla and a small set of vertically-integrated programs are designing custom silicon. In China, Horizon Robotics has built genuine share in autonomous driving and is pushing into humanoid edge compute, with Black Sesame and several smaller domestic players in adjacent positions.
Margins at this layer follow specialty-silicon economics. NVIDIA carries premium silicon margins on Jetson products, sustained by the CUDA ecosystem lock-in that took nearly two decades to build and that humanoid programs are not equipped to circumvent in the near term. Qualcomm runs at smartphone-derived margins, lower than NVIDIA but with significantly stronger power efficiency at given performance levels. The vertical integrators face the classic make-or-buy tradeoff.
The structural fact that defines L5 is that humanoid robot compute sits at a different point on the price-performance curve than mobile or automotive. Mobile chips optimize for power. Automotive chips optimize for safety certification. Robot chips need both, plus deterministic real-time response that neither mobile nor automotive natively provide.
Thesis: L5 is the second-most-defensible toll position in the stack after L4, and NVIDIA’s Jetson franchise will hold the majority of Western humanoid edge inference through at least 2028. The risk is not Qualcomm or Ambarella but vertical integration. If Tesla, Figure, or 1X successfully ship custom silicon at humanoid volumes within five years, the layer fragments and Jetson’s share collapses faster than the CUDA moat would otherwise allow.
L6: Data Infrastructure
Foundation models at L1 need data. Lots of it. The infrastructure that produces, processes, and pipelines that data into trainable form is L6, and it is the most structurally confusing layer in the entire humanoid stack.
The competitive shape splits into three sub-layers along distinct economic structures. Synthetic data and simulation, dominated by NVIDIA’s Cosmos World Foundation Models and Isaac Sim platform, with competition from DeepMind’s MuJoCo and a growing list of academic and open-source simulators. Real-world data, captured through fleet operations: Tesla’s deployed Optimus units, 1X’s NEO home deployments, Figure’s factory placements, and Unitree’s research customer base. And open data ecosystems, anchored by Hugging Face’s LeRobot, Google DeepMind’s Open X-Embodiment dataset, K-Scale’s open hardware program, and the steady output of academic robotics groups.
Margins look completely different across the three sub-layers. Synthetic data and simulation carry software economics, with NVIDIA pricing Cosmos and Isaac access at the kind of margins its data-center silicon products produce. Real-world data has no margin at all, because it is not sold. It accrues to whichever L2 integrator ships robots in meaningful volume, becoming a captive input to that integrator’s L1 model. Open data ecosystems carry no margin by design, but they create a price ceiling that constrains what commercial data providers can charge.
The structural fact that makes L6 confusing for investors is that the commercial opportunity and the strategic opportunity live in different places. The commercial opportunity is in synthetic data and simulation tooling, where NVIDIA has a near-decisive lead. The strategic opportunity is in real-world data flywheels, which are not investable as standalone businesses. They are the byproduct of L2 deployment scale, captured by whoever ships first. This split is why L6 sits across two profit pools rather than one: the commercial sub-layer joins the Brain Pool, the real-world data flywheel joins the Body Pool.
Thesis: L6 produces one commercial winner at meaningful scale, NVIDIA, sustained by Cosmos and Isaac in tight integration with the rest of its humanoid stack. Real-world data does not produce L6 winners. It produces L2 winners. Pure-play robotics data startups will mostly fail to find venture-scale outcomes, because the moat is in robot deployment volume, not in data infrastructure. The exception is the small number of annotation, simulation tooling, and benchmark companies that successfully attach themselves to a winning L1 lab as preferred providers.
Three Profit Pools
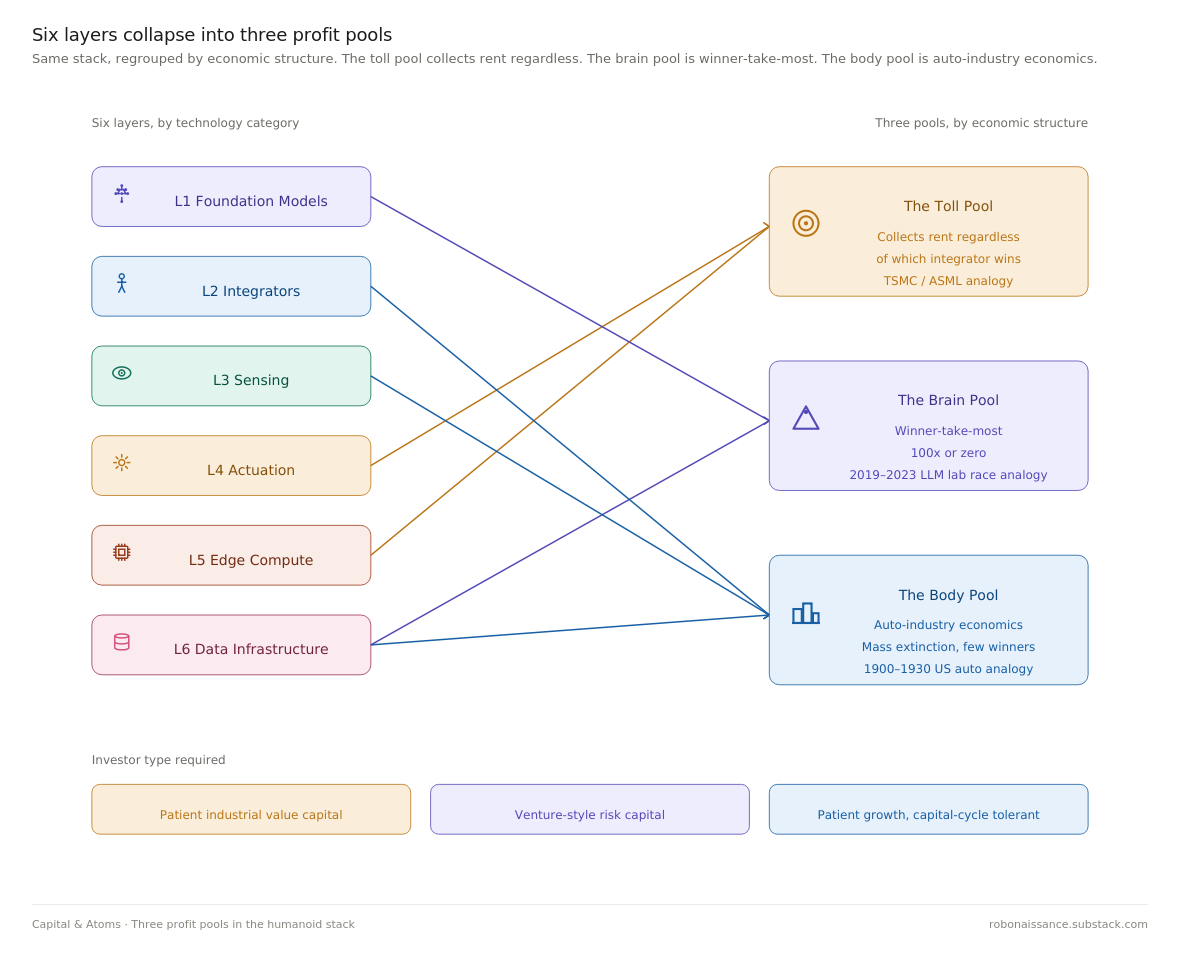
The six layers compress, when you look at them through the lens of where returns actually accrue, into three economically distinct pools. Each pool has a different risk profile, a different time horizon, a different appropriate valuation multiple, and a different historical analogue investors can pattern-match against. Mixing them in a single portfolio without recognizing the distinction is how humanoid robotics investment goes wrong.
The Toll Pool
The Toll Pool collects rent regardless of which integrator wins. It contains L4 actuation and L5 compute, the two layers where every humanoid built has to buy the same essential inputs from a small number of suppliers with structural pricing power.
Toll Pool investors are not betting on which humanoid company succeeds. They are betting that humanoid volumes, in aggregate, grow. NVIDIA on the compute side and the Chinese precision-component manufacturers on the actuator side both win whether Figure or Tesla or Unitree ultimately dominates the integrator layer. The bet is on the category, not the category winner.
Investment logic favors patient capital. Valuation multiples will look more like industrial automation or specialty semiconductors than like AI software. Today’s Chinese harmonic reducer manufacturers trade in the 25 to 35 times forward earnings range, which feels expensive against industrial benchmarks and cheap against the volume curve coming through the next five years. The historical analogue is TSMC during the smartphone buildout, or ASML during the EUV ramp. Less spectacular than the application-layer winners, but with returns that compound for longer and survive the bust phase intact.
The Toll Pool risk is that the toll gets disintermediated. Vertical integration by the largest integrators is the main vector. If Tesla, Figure, or one of the Chinese champions successfully internalizes harmonic reducer manufacturing or builds custom inference silicon at humanoid volumes, a meaningful share of toll revenue collapses to internal transfer pricing.
The Brain Pool
The Brain Pool contains L1 foundation models and L6 synthetic data and simulation. This is the humanoid robotics equivalent of the LLM trade. Winner-take-most economics, software margins at scale, talent and data flywheel moats, and the kind of variance that produces both the trillion-dollar outcomes and the zero-dollar outcomes.
Investment logic here is venture-style, not industrial-style. Returns are concentrated. Out of the current Brain Pool entrants, the market will sustain two foundation model winners and at most one commercial simulation winner over the next five to seven years, plus whatever the largest integrators build in-house. The remaining labs will be acquired at modest premiums or wound down. There is no graceful middle outcome.
Valuation multiples in this pool are not anchored to current revenue, which is functionally zero for most entrants. They are anchored to terminal value scenarios that look like Anthropic or OpenAI in 2030. The historical analogue is the 2019-to-2023 LLM lab race, with all of its associated capital intensity and concentration of outcomes. The fact that the public has barely begun to price this pool is, depending on your view, either the largest opportunity in the humanoid stack or the most dangerous late-cycle valuation distortion in technology investing.
Brain Pool risk is binary. The winners are 100x. The losers are zero. Position sizing must reflect this.
The Body Pool
The Body Pool contains L2 integrators, L3 sensing, and L6 real-world data. This is the layer everyone photographs and the layer where the most capital destruction will occur. Real-world data is grouped here rather than in the Brain Pool because it is not an independently investable asset: to own it, an investor must own the integrator that captures it. The same logic applies to L3 sensing: the bulk of perception hardware commoditizes against smartphone and automotive demand, while robot-specific perception value is largely captive to L2 in-house development.
Investment logic mirrors the early automotive industry. Many entrants, brutal competition, capital-intensive scale-up curves, and a small number of survivors who eventually achieve manufacturing economics that earn back the buildout. The right pattern-match is not Apple Inc. It is the period from 1900 to 1930, when something like 2,000 American automakers consolidated to roughly three. The winners earned generational returns. The losers, including some of the most well-funded and best-engineered, lost everything.
Valuation multiples in the Body Pool will compress dramatically from current private-market levels as the public-market path opens and unit economics become visible. The integrators that survive the compression will be those who internalize enough of the L4 cost structure to escape the auto-industry margin trap, while shipping enough volume to build a defensible data flywheel that strengthens their L1 capabilities.
Body Pool risk is that the median entrant fails commercially. Two or three right-tail winners will deliver virtually all of the layer’s positive investor returns. The expected value calculation depends almost entirely on whether the investor can identify those winners early enough to weather a decade of dilution and capital calls.
The three pools require three different investor types. The Toll Pool wants industrial value investors. The Brain Pool wants venture-style risk capital. The Body Pool wants the kind of patient growth investor who can hold through capital-cycle volatility. Allocating across all three is possible, but the rare fund that does so successfully will be one that recognizes the pools are not interchangeable.
The Humanoid Stack in Five Years
The test of the framework above is not whether it sounds compelling today. It is whether the predictions it generates hold up when 2030 arrives.
Three predictions, each tied to one of the three pools, each accompanied by the conditions that would put it at risk.
Prediction One · L4 Consolidates Around Chinese Champions
By 2030, three or fewer Chinese precision-component manufacturers will collectively supply more than 60% of harmonic reducers and planetary roller screws used in humanoid robots shipped globally. The current top entrants in this race are 绿的谐波 (Leaderdrive), 双环传动 (Shuanghuan Driveline), 中大力德 (Zhongda Leader), and 来福谐波 (Laifual), with a longer tail closing the technical gap. Japanese and German incumbents will retain premium positions in specific high-performance niches but will lose volume share decisively.
The structural drivers are cost, scale, and policy. Chinese suppliers are already manufacturing at unit economics the Japanese incumbents cannot match without abandoning the precision tolerances that justify their pricing. The humanoid wave layers volume on top of supply chains already at scale for electric vehicles and industrial robots. Chinese industrial policy is actively subsidizing the buildout.
Prediction Two · The L6 Surprise Comes From Simulation
By 2030, the largest commercial winner in L6 data infrastructure, outside NVIDIA’s first-party Cosmos and Isaac businesses, will be a company that does not yet exist as a venture-stage entity in 2026, or exists only in seed stage. It will win by building the simulation and synthetic data tooling that humanoid integrators use to train and evaluate policies before deployment, capturing margin in the gap NVIDIA’s first-party tools leave open.
This is the most contrarian of the three predictions. Most current Brain Pool capital is flowing to L1 foundation model labs. The L6 simulation layer is currently treated as either NVIDIA’s territory or as open-source commodity. Both treatments will turn out to be wrong. The category needs a specialist with vertical depth in robot-relevant simulation that NVIDIA is too horizontally focused to build, and that the academic open-source community will not productize at sufficient quality.
Prediction Three · The L2 Mid-Tail Wipeout
By 2030, of the more than one hundred humanoid integrator companies operating globally in 2026, fewer than fifteen will remain as independent commercial entities. Of those fifteen, three to five will dominate global shipments. The remaining survivors will occupy regional or vertical niches. The wipeout will not happen in a single year. It will arrive as a series of down rounds, quiet acquisitions, and shutdowns spread across 2027 to 2029, with the worst concentration in 2028 as the first generation of growth-stage capital exhausts its runway against deployment economics that fail to scale on the timelines promised in pitch decks.
Early investors in the median Body Pool entrant will lose substantial portions of their capital. Early investors in the right-tail winners will earn the returns that justify the entire humanoid robotics investment.
Where This Begins
Five trillion dollars of capital will sort itself across this stack by 2050. Most of it will misallocate. The framework above is one attempt to think about which slice will not. Capital & Atoms is the work of getting it right.
Sources
Unitree IPO Prospectus: Pricing and shipment data, filed March 20, 2026 on Shanghai STAR Market. Coverage via Rest of World, March 2026.
Humanoid Funding H1 2025: $3.1 billion across 60+ deals exceeding 2010-to-2024 cumulative total. IPO Club Humanoids Report, citing iCapital Market Pulse, November 2025.
Morgan Stanley $5 Trillion Projection: “A $5 Trillion Global Market” research note. Morgan Stanley Insights, April 2025.
Figure Series C: $1 billion+ committed capital at $39 billion post-money valuation. Figure AI Official Announcement, September 16, 2025.
Physical Intelligence Series B: $600 million round led by Alphabet’s CapitalG at $5.6 billion valuation. Bloomberg, November 20, 2025.
Skild AI Series C: $1.4 billion round led by SoftBank at $14 billion+ valuation. BusinessWire Press Release, January 14, 2026.
Apptronik Series A Extension: $935 million total at $5 billion+ valuation. GlobeNewswire Press Release, February 11, 2026.
This is Capital & Atoms, a research thread within Robonaissance focused on the investment economics of humanoid robotics.
Disclaimer: This article is for informational purposes only and does not constitute investment, financial, or legal advice.