
Tokenomics, Part 1: The Token Is the New Kilowatt-Hour
Token prices have fallen by two orders of magnitude in three years, more on the cheapest routes. The Token Stack. Margin Geography. Where the value went, and where it is going next.


A million tokens cost roughly thirty dollars on a leading API in early 2023. By 2026 the same million tokens, at production quality on competitive APIs, cost in the range of ten to thirty cents. On cached inputs and small-model routes, single-digit cents or less. Two orders of magnitude at the headline, three or more at the extremes, in three years. There is no precedent in the recent history of compute for a unit to compress that fast.
The question this series asks is not how it happened. The mechanics are widely covered. The question is where the margin went.
When a commodity drops a hundredfold in three years, and ten times further along the cheapest paths, it produces a slaughter. The slaughter has winners. The pricing power did not disappear when token costs fell. It migrated. Understanding where it migrated to, why, and where it is going next, is the only question in AI economics that consistently rewards reading.
This is the first article in Tokenomics, a series about the economic physics of artificial intelligence. The unit of analysis is the token. The framework is geographic: margin sits somewhere in the AI stack, and that somewhere is moving. Over nine articles, the series tracks the movement, layer by layer, with the goal of producing a structured way to think about value capture in an industry where conventional moat analysis has stopped working.
This article does two things. It defines the unit. And it introduces the two frameworks that the rest of the series deploys.
The Unit
To analyze a token economy you have to know what a token is. The technical answer is short. A token is the elemental piece of text a language model processes. Most short words are one token. Long or unusual words split into multiple tokens. A page of English prose is roughly five hundred tokens. The model receives a sequence of tokens as input, produces a sequence of tokens as output, and the operating cost of any AI service reduces, finally, to the count of tokens passing through.
The economic answer matters more. The token is the atomic, billable unit of a capability that was previously unmetered. Before token pricing, intelligence was something a company employed, in the form of staff, with overhead costs and contracts. After token pricing, intelligence is something a company purchases, by the unit, the way it purchases electricity. This is the structural shift. The token is what makes AI an economy rather than a research field.
Electricity is the canonical case for what happens next. The phenomenon was demonstrated in laboratories for decades before it transformed industry. What changed was not the invention. What changed was the unit cost. When electricity became cheap enough to meter, price, and budget against, every industry that touched it restructured itself around the kilowatt-hour. Steel reorganized. Aluminum became economically possible. Whole categories of business that could not exist at the old cost emerged because the new cost made them viable.
The token is at the same point. The phenomenon of language models has been demonstrated for years. What is changing now is the unit cost. The hundredfold-and-beyond price compression is the unlock, not the underlying technology. As tokens become cheap enough to budget against, AI is restructuring itself around the unit. The companies that survive the next five years will be the ones whose business models reorganize around tokens the way prior generations reorganized around the kilowatt-hour. The companies that do not survive will be the ones whose models were built on the assumption that the unit cost would stay where it was.
The Scissor of Token Economics
Token economics moves along two curves, governed by independent forces. Confusing them is the most common error in commentary about AI costs.
The first curve is the price of a token. What it costs to produce one. Two forces compress this price. Hardware raises throughput per dollar of infrastructure: faster chips, denser memory, better interconnects. Every improvement in hardware throughput lowers the cost of producing a token. Model improvements let the same hardware produce the same quality output with less computation. Mixture-of-experts designs activate only a fraction of parameters per token. Distillation produces small models with capabilities close to large ones. Quantization runs models at lower numerical precision without significant quality loss. Speculative decoding, sparse attention, and a half-dozen other techniques each cut the price of a token by some multiplier. The compounding effect across these innovations is the hundredfold-and-beyond price collapse the headlines celebrate. Model innovation is responsible for more of the compression than hardware is.
The second curve is the token consumption of a task. How many tokens a task requires to be completed. Workload is the consumption pattern that decides this number, and it is moving in the opposite direction from price. A chat query consumes a few hundred tokens. A code completion consumes a few thousand. A document analysis consumes tens of thousands. An agent task that orchestrates sub-agents, each calling tools, each processing context, consumes millions. As workloads shift toward agents and longer context, token consumption per task rises.
The two curves move against each other. Per-token price has fallen by two orders of magnitude at the headline and more on the cheapest routes. Per-task consumption is rising by orders of magnitude as agents become standard, depending on which workload class you measure. Multiply them, and the product is what an enterprise actually pays per task.
This is the first lens. For any specific question the series will treat, the answer factors along both curves: what hardware and model innovations did to the token price, what workload evolution did to the tokens per task, and which blade of the scissor the question is really asking about.
The two-curve scissor is a first-order model. Real token economics fragments further. Token prices split into input and output, cached and non-cached, with output typically three to ten times the cost of input and cached routes a fraction of either. Token consumption fragments by task type, with agent workloads weighted toward high-output and low-cache shares that no aggregate average captures. These dimensions multiply within the scissor; they do not change its direction. The series unpacks them, layer by layer, in later articles.
The Token Stack
This brings the series to the first of its two frameworks.
The Token Stack maps the cost structure of the AI economy. Four layers, stacked vertically.
At the top, applications. What users actually pay for. The products, the subscriptions, the per-call APIs that sit closest to the customer’s wallet.
Below applications, inference. The cost of running models against user inputs. Measured per token. Governed by latency requirements, serving infrastructure, and pricing strategy.
Below inference, the model. Pre-training and post-training, the cost of producing a model that is capable of being served at all.
Below the model, infrastructure. The chips, the energy, the data centers, the cooling. The physical substrate that everything above depends on.
Cost flows up. A user paying for an application is paying, indirectly, for the inference that produced their result, which is paying for the model that was trained to make that inference possible, which is paying for the infrastructure that supports the whole arrangement. The price of a subscription contains, embedded within it, the price of every layer below it.
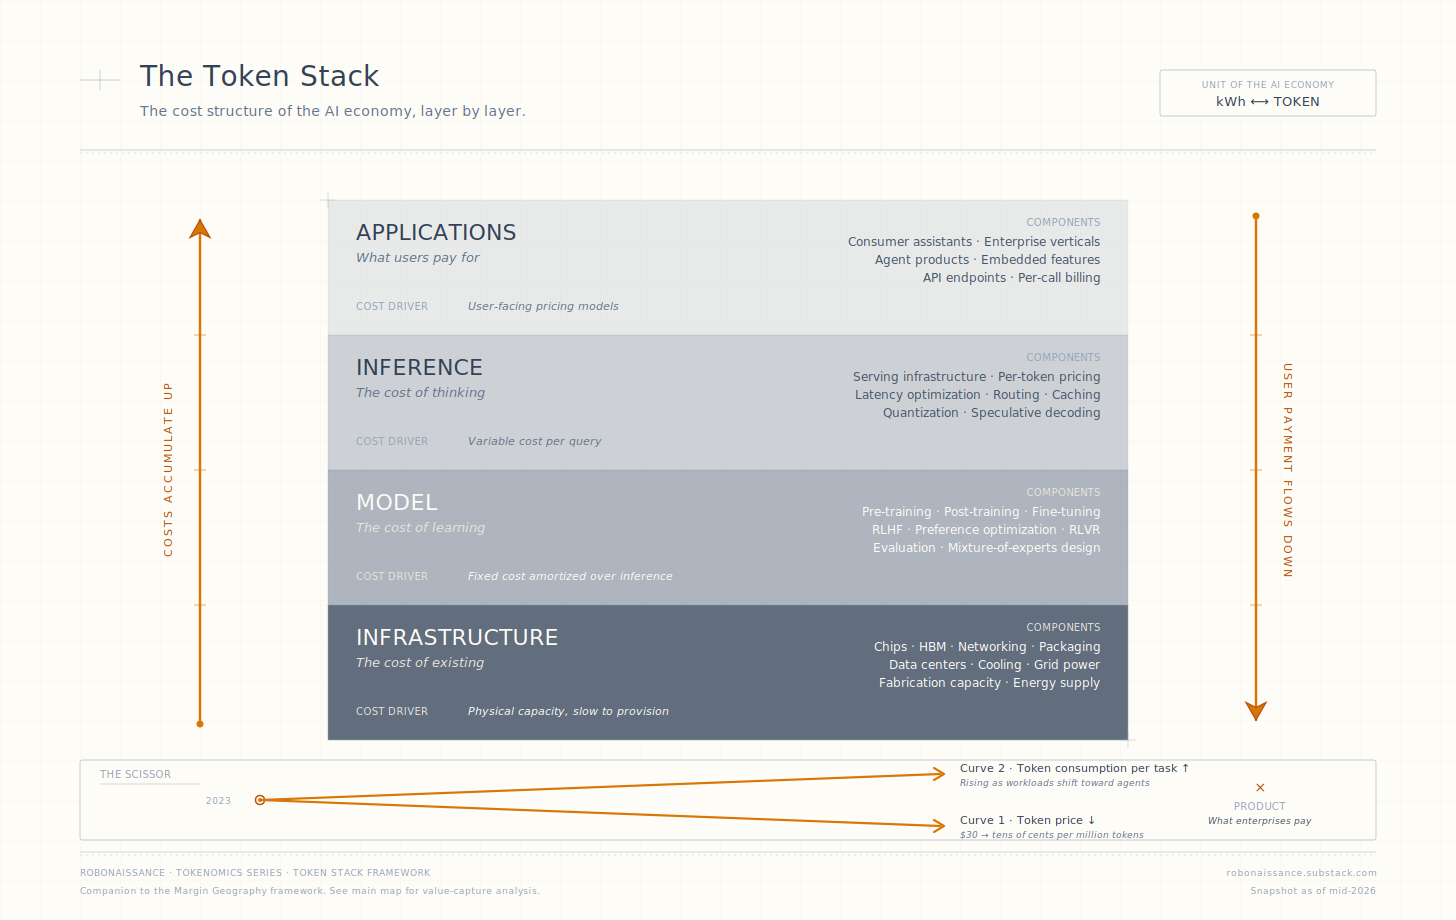
The Token Stack: the cost structure of the AI economy in four layers. Each layer pays for everything below it; user payment at the top supports the whole arrangement. The price compression from $30 per million tokens in 2023 to ten to thirty cents on competitive APIs in 2026, with single-digit cents and lower on cached and small-model routes, is what makes the rest of the framework matter.
This is the descriptive map of the AI economy. It tells you what costs what, what units mediate value, and how the layers depend on each other. It is the cleanest mental model for translating “AI is getting cheaper” into a precise statement about which component is getting cheaper, which is getting more expensive, and how the net effect produces a hundredfold-and-beyond collapse at the user-facing layer.
But the Token Stack does not answer the question this series is built around. The Token Stack tells you what something costs. It does not tell you who keeps the money.
The Other Half
There is a second framework, and it does most of the analytical work in the series.
Margin Geography maps where value gets captured in the AI stack, and where that capture is migrating to next.
If the Token Stack reads the supply side, what it costs to produce a token, Margin Geography reads the demand side and the capital side, where revenue accumulates from token consumption and how those positions change as the economy scales. The two frameworks are not redundant. They are the two faces of the same economy. One asks what it costs. The other asks who keeps it.
The framework operates along three dimensions.
The first is the stack layer. Same four layers as the Token Stack: applications, inference, model, infrastructure. Margin can sit in any layer, in several layers at once, and shift between them.
The second is the scarcity type. A layer holds margin not because of where it sits but because of what makes it scarce. Seven scarcity types recur: capital, talent, energy, distribution, data, regulatory, and network-effect. A margin position resting on one scarcity is fragile. A position resting on three reinforcing scarcities is durable. The seven types are the analytical alphabet of the framework.
The third dimension is the migration pressure. Margin in AI does not settle. It moves faster than in any prior technology cycle, for reasons specific to this industry: the price collapse on the underlying unit, the open-weight competition that sets a floor on every layer, the architectural substitution that displaces premium capability with cheap capability. For every layer that holds margin today, identify the active pressure that is eroding the scarcity. Substitution, commoditization, disintermediation, geopolitical shift, demand saturation. The intersection of layer, scarcity type, and migration pressure produces the framework’s primary output: a map of where margin sits today, and a thesis about where it is moving next.
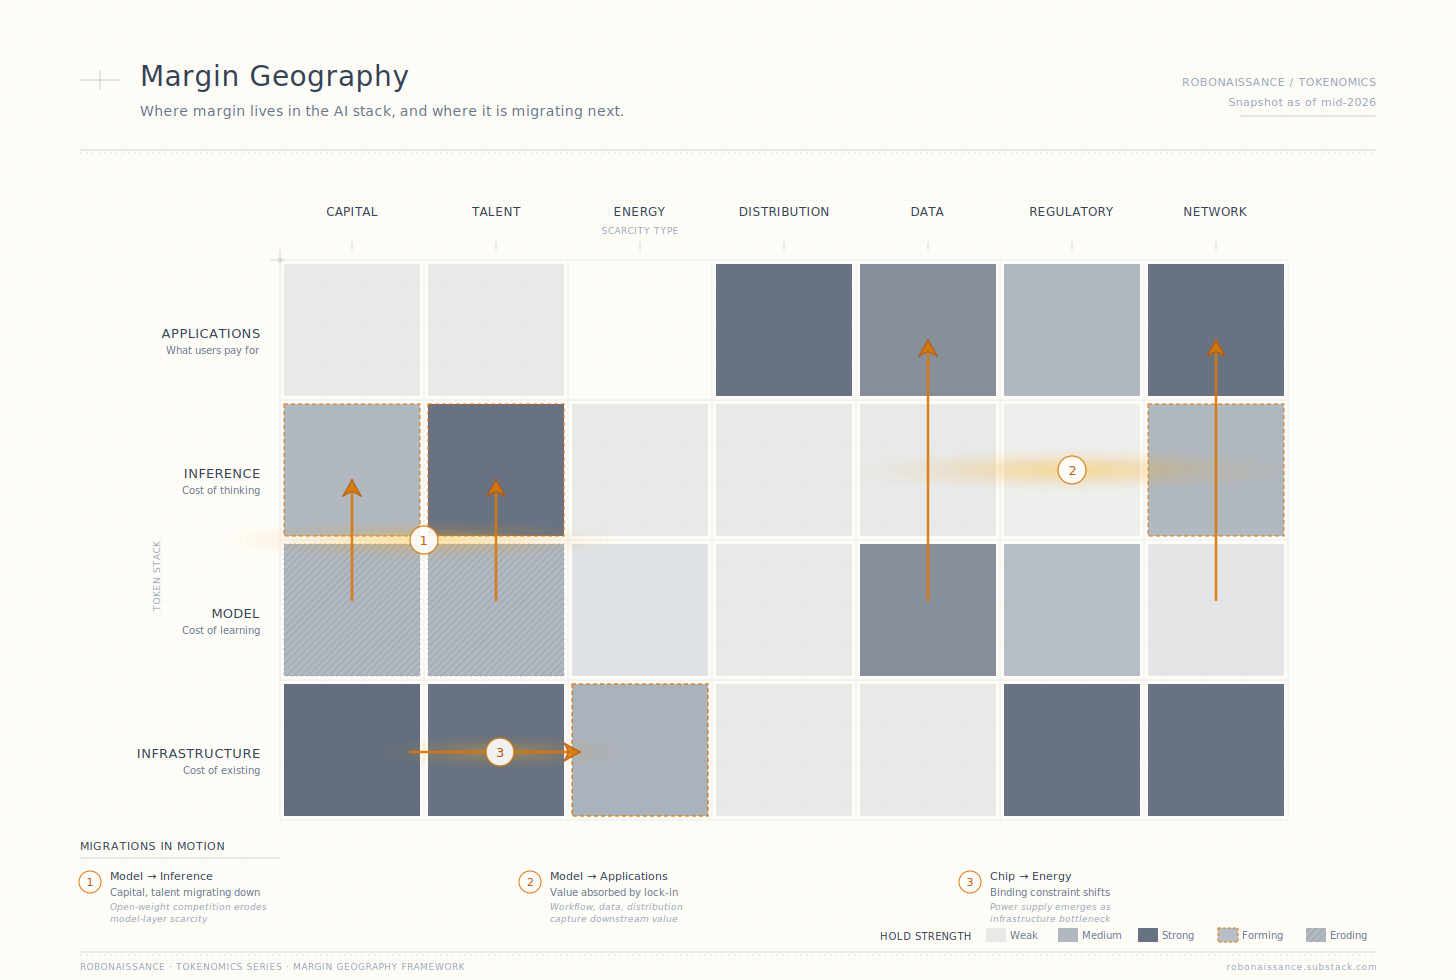
Margin Geography of the AI stack, as of mid-2026. Each cell shows whether a scarcity type holds the corresponding layer, and at what strength. Amber dashed borders mark scarcities that are forming. Diagonal hatching marks scarcities that are eroding. The three groups of amber arrows track migrations currently underway. Each migration is the subject of subsequent articles in the series.
The framework is not a stock-pick tool. It does not produce specific buy or sell recommendations on specific companies. It operates at the layer level. Specific companies appear in the series as evidence of where margin sits at a moment in time, not as the unit of analysis. This is a deliberate constraint. The companies that hold margin today are not always the companies that will hold it three years from now, and the framework is built to surface the migration, not to recommend the position.
One Worked Example
To show the framework in action, consider one layer: inference.
The inference layer in 2026 holds margin where three scarcity types are forming at once.
Talent is the most acute. Building serving infrastructure that delivers competitive token throughput at acceptable latency and acceptable cost requires optimization engineering that has not yet diffused. The teams that have solved the inference problem at production scale are concentrated in a small number of organizations. The expertise is portable in principle but slow to spread in practice.
Capital is the second. Specialized inference infrastructure requires investment that smaller players cannot match. The serving optimizations that produce competitive economics depend on hardware configurations, software stacks, and operational practices that compound through expenditure over time.
A network effect is forming as a third scarcity. Once an application has been built on an inference provider’s API patterns, latency characteristics, and tooling, the switching costs are real. The lock-in is not yet permanent, but it is forming.
What is the active migration pressure on these scarcities? On talent, the diffusion is gradual but ongoing. On capital, the picture is mixed: hyperscale spending continues to flow into inference infrastructure, but custom silicon programs at the largest cloud providers are starting to compress the margin available to general-purpose inference providers. On the network effect, the layer is still forming; the developer lock-in is not yet locked.
What does this read of the layer imply? The inference layer is in a margin formation phase, not a margin erosion phase. The companies that establish defensible positions in the next eighteen to twenty-four months will hold those positions for years. The companies that fail to establish positions in that window will not establish them later. The layer locks in once. This is the kind of structural reading Margin Geography is designed to produce.
What the Series Will Do
This article is the entry point. Over the next eight articles, the framework gets deployed across the AI stack.
Article 2 takes the most consequential migration first: training to inference, the move that is reshaping the largest pool of AI profit in the industry. Article 3 examines the agent tax, the structural transfer of margin that agent adoption produces, with attention to how seat-based software pricing is giving way to token-based consumption. Article 4 maps the applications layer in detail, where a three-way split between thin wrappers, token-consuming SaaS, and workflow-rich applications is producing a divergence that will define enterprise software for the rest of the decade.
Article 5 analyzes the infrastructure layer at the margin-analysis level, with deliberate complementarity to the dedicated industry research that handles the supply-side detail better than a publication should attempt. Article 6 treats pricing as the active mechanism through which margin gets distributed between layers, with attention to which pricing transitions are actively reshaping the geography. Article 7 examines efficiency innovation as a margin redistribution event whose direction the market consistently misreads.
Article 8 reads China’s parallel margin map, structurally different from the US stack in ways that English-language coverage rarely captures. Article 9 projects the geography forward, with the framework deployed against a five-year horizon.
The thesis runs through every article. Tokens are the atomic unit. The cost is going one way. The margin is going somewhere else. Knowing where it is going is the question that rewards careful work in AI economics. This series is an attempt to do that work in public, on a unit small enough to count and a stack large enough to remap an industry.
This is Tokenomics, a series that explores the economic physics of the AI era, measured in the unit that runs it all.
Disclaimer: This article is for informational purposes only and does not constitute investment, financial, or legal advice.
the two-curve scissor explains what broke Anthropic in early 2026. token price kept falling on paper while Claude Code turned every session into a million-token agent loop. the product of those two curves overwhelmed their infrastructure until the xAI deal filled the gap.
but there's a third curve the article doesn't name: quality per token. Anthropic responded to the demand spike by compressing reasoning depth 67%, killing third-party access overnight, and reserving full Opus
inference for $200/month subscribers. same price on the invoice, less thinking behind it. the kilowatt-hour analogy holds, except not all kilowatt-hours think equally hard, and you can't tell which kind you're getting until the output disappoints you.
insightful and timely analytical framework.